Optimize the lifespan of your batteries with advanced simulation.
- Oct 30, 2025
- 11 min read

Aging affects most things on Earth, and batteries are no exception to this phenomenon. In a very peculiar way, batteries behave like "living" beings; their particles flow between two electrodes, there are chemical reactions, and even mechanical changes, such as an effect similar to "breathing" (expansion and contraction of the electrodes due to the intercalation and deintercalation of lithium during charge/discharge cycles). They are simply in operation, which generates natural wear and tear.
You Can't Stop Aging: Electric Vehicle Fleets Will Age (and so will their batteries)
However, when people consider buying an electric car, the number one criterion for them is range, followed by price and charging logistics (infrastructure and charging time). Concern about battery life only appears in 6th position. Today, this ranking may not be surprising, considering that most electric vehicles are bought new and aging seems to be a rather technical topic, with a wide variety of possible evolutions in battery life depending on the use of the electric vehicle.
But, as electric vehicle fleets age (and with them their batteries), the used car markets begin to grow and, suddenly, for good resale prices, the lifespan and health of the batteries will certainly increase in importance (as predicted). Similarly, recycling battery cells that have reached the end of their useful life is still a very expensive and energy-intensive activity.
And therefore, longer-lasting and more sustainable battery cells are already a competitive factor for those who design and sell electric vehicles and batteries. So, the time has come for OEMs and battery manufacturers to understand battery aging and develop cell designs that provide maximum lifespan.
Engineers must understand not only when, but also where aging mechanisms occur.
Using simulation with aging models can significantly help accelerate the prediction of the degradation trend of a given battery. Typically, 1D level simulations are used in this case, as they allow for very fast execution and can produce years of simulated data in a few hours.
Throughout this article, it will be exemplified how this can be done in a simulation environment where physical phenomena are modeled, but first let's learn a little more about the causes of battery aging.
The Toxic Ingredients That Cause Battery Cell Aging
So, what triggers and affects aging? Battery aging has its root causes in several factors. First, unsurprisingly, time: whether the cell is being used or remains idle, time is at work allowing some internal chemical reaction to induce some performance degradation. Second is temperature: temperature has a significant impact on the battery lifespan degradation process. Storage and use at high temperature (high range of safe temperature limits) would accelerate aging. Low temperatures are better, but combined with fast charging can be recipes for other degradation effects. This leads to the third main criterion, the current applied to the cell. Basically, referring to the type of load applied to the battery. If it is used gently with smooth and low power demands, the current applied to the cell will be smooth and slowly affect aging. However, if the battery is used more aggressively, with more frequent fast charging, particularly under low temperature conditions, the accelerated degradation mode will be activated.
A deeper analysis of battery cell degradation mechanisms

What happens within the battery due to these effects is a combination of several degradation mechanisms:
Solid Electrolyte Interface film growth: This is the slow growth of a thin, porous layer on the surface of the active material, which consumes Lithium atoms to grow. As it grows the inventory of available lithium, used for the cell operation, decreases, reducing the cell’s capacity. Also, the thickness of the SEI film creates a barrier to the Lithium ions and electrons trying to go in and out of the active material, which increases the cells’ overall electrical resistance
Lithium plating. In this case, there is formation of lithium metal film on the surface of the active material, which also consumes the lithium inventory impacting the cell capacity.
Loss of active material by dissolution: Active material responsible for storing lithium is dissolved into the electrolyte due to some undesired side reaction. The loss of this active materials further decreases the cell capacity.
Loss of active material by mechanical cracking. The Lithium intercalation and de-intercalation process generates at each cycle some mechanical stress. Overtime parts of the active material can break down and be separated from the main electrode. This has the effect of losing ability to store lithium and further decreases the cell capacity.
The bottom-line consequences of these effects are simple, your battery’s capacity will decrease, reducing your vehicle range compared to its brand-new range. And it will be less able to sustain aggressive power demands, reaching more rapidly the lower and maximum voltage safety limits, leading to the battery’s shut down.
Aging takes time – that engineers don’t have
That's why battery and vehicle manufacturers dedicate time and effort to characterizing these aging phenomena. But here's a challenge: the effects of aging can only be observed after several years of operation. Therefore, as you can understand, conducting tests to capture the correct degradation behavior requires an enormous amount of time and money to test the battery over the years of operation!

Of course, there are some accelerated aging testing techniques, but the first results can only be seen after at least 6 months of accelerated aging tests.
But to gain a competitive advantage, engineers analyzing these aging challenges need more detail; they need to further optimize the battery cells and understand not only when, but also where the aging mechanisms occur, so that they can better address degradation problems locally.

EV battery cell formation (the initial charge) is a critical manufacturing step with respect to battery cell aging risks (Image: Chroma ATE).
Inspection & Identification
The first stage of the process.
Battery cells are inspected and identified before entering the formation cycle.
Formation
This is where the initial charging of the cell happens — known as the “formation” process.
A critical step that defines the cell’s electrochemical properties and directly impacts its lifespan.
Ambient Aging
Cells rest in ambient temperature conditions.
This step allows the materials inside the cell to stabilize after formation.
High Temperature Aging
Cells are kept at elevated temperatures to accelerate aging and detect early defects.
Ensures only stable cells move forward in the production line.
OCV & ACR Testing
Electrical testing to measure:
OCV (Open Circuit Voltage) – voltage when the cell is not under load.
ACR (Alternating Current Resistance) – internal resistance of the cell.
These tests assess the performance and quality of each cell.
Sorting
Cells are classified based on results from electrical and aging tests.
Cells with similar performance are grouped together to form consistent battery modules or packs.
And it's not only aging that needs to be studied during operation: equally relevant is the initial charging process, known as formation, which is the critical final stage of manufacturing before the cells are shipped. It forms the crucial protective layer of the Solid Electrolyte Interface and therefore has a huge impact on the subsequent lifespan of the battery.
Battery aging simulation
There are several approaches to leveraging simulation to predict aging and the formation process.
Firstly, our Simcenter Amesim systems solution, using 1D models, can be extremely efficient in rapidly generating years of aging simulation data under various operating conditions. The main advantage here is time acceleration. Physics-based aging models in Simcenter Amesim have been available since version 2410, in addition to the existing empirical aging models.
In this type of simulation, each cell is represented by blocks that describe its electrical and thermal behavior—capacity, internal resistance, and heat exchange with the environment. By connecting multiple cells in series and parallel, it is possible to predict how performance and temperature evolve over time, simulating battery aging and allowing for design adjustments before moving on to more detailed 3D analyses in Simcenter STAR-CCM+.

Second, to address the need for spatial information, Simcenter STAR-CCM+'s 3D Cell Design solution can predict aging evolution in a 3D cell geometry with resolved electrode layers. Of course, in this case, the execution time is much longer than in 1D simulations, but the user will have access to local information about where aging occurs and can mitigate these effects by changing the design or operating conditions.
Thirdly, it is possible to combine 1D and 3D simulations. The 1D simulation is used to generate the very long-term aging simulation over years of physical time. Users can then extract from this discrete point the cell's State of Health (SOH) over the aging period, for example, every year. This SOH for each year can then be a starting point for a 3D simulation, where the cell is aged only for a short period, for example, 1 month of physical time, but long enough to generate the distribution of the various aging mechanisms, such as Solid Electrolyte Interphase (SEI) growth or lithium plating, as implemented in more recent versions of Simcenter STAR-CCM+. Obviously, the 1D and 3D aging models are coupled with thermal models to capture the thermal effect on the evolution of degradation mechanisms.
Finally, 3D simulations can be used to assist in predicting the initial Solid Electrolyte Interphase (SEI) layer during the manufacturing formation process. In fact, the SEI growth model can be used in the first charge of a battery cell and predict the growth of this critical protective layer. The 3D Cell Design feature can then help the user evaluate the uniform evolution of the SEI layer growth and determine the optimal point at which the layer is sufficiently thick and the amount of lithium consumed to generate it. This will help further refine the estimate of cyclable capacity.
High fidelity battery aging simulation with Simcenter STAR-CCM+
Aging through parasitic side reactions with Sub-grid Particle Surface Film model
Available since the release of Simcenter STAR-CCM+ 2406, the “Sub-grid Particle Surface Film” model in the Battery Cell Designer allows simulating the cell's response to a duty cycle in relation to two of the main degradation mechanisms:
The growth of the Solid Electrolyte Interphase (SEI) film
The growth of the lithium metal plating film
An Active Material Particle, presented at NordBatt Conference
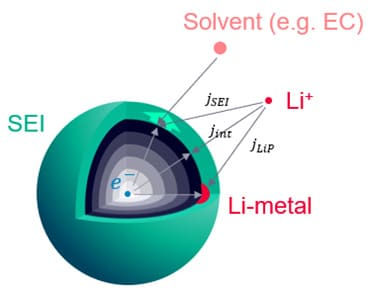
These are both parasitic side reactions which occur during the cell operation. Lithium plating is the deposition of Li-metal on the particle surface. And SEI is the film created from the reaction between the particle and the electrolyte.
Due to the side reactions, the amount of cyclable lithium reduces, you can simply track the remaining lithium in the electrolyte and the active material. This should allow to check the effect on the capacity. The film resistance area (resistivity times thickness) is also a field function which can be tracked and contributes to the overall internal cell resistance.
Mechanical-induced degradation with the Sub-Grid Particle Aging model
Simcenter STAR-CCM+ includes "Sub-Grid Particle Aging," which focuses on degradation effects of a mechanical nature. In this case, the loss of active material due to mechanical stresses is characterized by alternating stresses during charging and discharging, i.e., the cyclic insertion and extraction of lithium from the active material particles, which can lead to the formation of cracks in the electrodes. This can cause loss of electrical contact and reduction of usable active material, leading to an overall loss of cell capacity and an increase in internal resistance.

Active material particles undergoing surface cracking and loss of active material
There are two types of cracks forming, represented with two model options under the “Sub-grid Particle Aging” model:
First one is the “Loss of Active Material” model. It is characterized by the cracking of particles or electrode “blocks”, leading to an electrical contact loss of active material particles, making those particles electrochemically inert and no longer participating in the electrochemical reactions. These particles represent therefore a loss in cell’s capacity
The second effect is the “Surface Crack Growth” model. The cyclic insertion and extraction generate cracks within the particles themselves. Those cracks expose a new surface for the Solid Electrolyte Interface (SEI) to grow, leading to Lithium consumption and therefore an overall capacity loss and internal resistance increase.
Note that this model option is compatible with the “Sub-grid Particle Surface Film” model enabling the SEI growth effects simulation.
Also note that, some publications on the topic suggest, that the tortuosity should increase when the surface cracks grow.
A trustworthy battery aging simulation framework
The abovementioned aging models were validated against experimental measurements generated during the EU commission funded project MODALIS², which was focusing on developing physics-based aging models for the latest generation of Li-ion battery cells. This work was performed with key industrial partners specialists in the field of batteries, such as a cell maker, cathode supplier and electrolyte supplier.
All that said, thanks to high physical modeling fidelity and the unique three-dimensional implementation of the models, these aging models offer you the ability to localize areas of the cell which most impacted by all types of aging. This is in theory. So let’s look at those models in action.
Simulating aging cycles in 3D
This first example was presented at the NordBatt conference in 2022 by my colleague Stefan Herberich from SIEMENS. A prototype cell used in the EU-funded MODALIS² project was used, and the cell is tested over several cycles with aggressive aging conditions to locate the weak areas where degradation is most dominant.
The cell considered consists of 15 electrochemical layers. The discretized cell is shown below, along with some results. In total, there are approximately 200,000 finite volume cells. In particular, the thickness direction is discretized using 10 cells per anode and cathode layer and 2 cells for the separator and current collectors.
The drive cycle consists of the following steps: first, charging is performed with constant current (CC), applied at a rate of 2C. C-rates indicate the ratio between the charging current and the battery capacity—at 1C, a fully discharged battery (0% state of charge, or SOC) is fully charged in 1 hour; at 2C, the current is doubled, and charging is completed in approximately 30 minutes.
If the voltage exceeds 4.2 V, the process switches to constant voltage charging mode, remaining at 4.2 V until the state of charge reaches 95%. The 4.2 V limit is reached quickly. Then, the battery remains at rest for a little over 3 minutes and is then discharged to 60% state of charge, also at a rate of 2C. After another rest period, the complete cycle is repeated ten times.
Interpretation of results
The study provides insights into the effects of the two aging mechanisms that occur: SEI growth and the influence of lithium plating side reactions. The images show the average thickness of the SEI layer around the particle and the equivalent average thickness of the plated lithium on a particle, respectively. The corresponding results were observed on the anode plane and in a cross-section in the direction of the cell thickness.
In addition to the analysis of the SEI, this study also provides important information about LAM (Loss of Active Material), which refers to the degradation or inactivation of the electrode material that participates in the electrochemical reactions.


In the plane: the thermal boundary conditions are such that the highest temperatures are observed in the center of the battery cell. At this location, the temperature dependence of multiple material parameters leads to higher SEI growth rates. LAM is pronounced near the battery tabs, where the highest rates of voltage variation are observed.
In thickness: As expected, SEI and LAM growth are greater near the separator. The operating conditions are such that the lithium metal, with an initially specified homogeneous profile, is dissolved more quickly than deposited, especially near the separator.
SEI during the formation step
The second study will be on SEI during the initial charge, also known as formation. Using the results presented in “Andrew Weng et al. 2023 J. Electrochem. Soc. 170 090523”, Simcenter STAR-CCM+ and the “Sub-grid Surface Film” model were used to replicate this study. The article describes the formation of SEI, i.e., the accumulation of a passivation layer on the graphite anode of a battery during the first charge cycles.
The film layer is formed due to a side reaction of the solvent components S, ethylene carbonate (EC) and vinyl carbonate (VC), with Li+, which produces the film components P, lithium ethylene dicarbonate (LEDC) and lithium vinyl dicarbonate, and gaseous byproducts Q.
Only the first 4 hours of the formation process were simulated, which is when the rapid dynamics occur and the transition from the kinetically limited regime to the diffusion-limited reaction regime takes place.
The results reasonably correspond to the reference:


The results demonstrate the ability to use Simcenter STAR-CCM+ in an approach to understand the SEI formation process, but also to be able to better control it and brings the potential to reduce its overall duration, which in some cases can last up to ~20 days.
Want to understand how to predict and mitigate battery aging with high accuracy and efficiency? Schedule a meeting with CAEXPERTS and discover how Simcenter Amesim and Simcenter STAR-CCM+ solutions can revolutionize the development of longer-lasting and more sustainable cells for electric vehicles.
WhatsApp: +55 (48) 98814-4798
E-mail: contato@caexperts.com.br


